Originally Published in Chronicle PharmaBiz on July 13, 2019 and CIOReviewIndia in July 2019
June 15, 2019
Author:
Steve Galen
Global Head, Clinical (CRO) Division
Navitas Life Sciences
Abstract
Designing and running clinical trials is very complicated and expensive, and in many ways, each trial is unique. However, by applying general manufacturing principles and thinking, it is possible to distill out those processes that are common to all trials and show their interconnected nature, both operationally and mathematically. This approach allows clinical trial performance to be characterized by a limited number of independent variables, and clinical trial performance to be optimized so that the clinical trial “manufacturing line” produces its “final product”, clean data, in the quickest, and most cost-effective manner possible.
Article
At first glance, it seems that applying a manufacturing lens to the designing and running of a clinical trial makes very little sense. Modern manufacturing assumes that processes can be designed and optimized using robust computer modeling techniques, equipment to run those processes can be built and installed, and the resulting manufacturing process can be instrumented to collect data in such a way as to permit central oversight and automation. For those who have been involved in the designing and running of clinical trials for any period of time, the ability to apply the “modern manufacturing” approach articulated above to a clinical trial seems farfetched.
It’s not.
To support this, it is necessary to show that:
- A clinical trial is made up of clearly characterizable individual subprocesses that are operationally and mathematically connected into one overall process whose final output is clinical trial data.
- These individual subprocesses can be mathematically characterized from first principles into closed form equations and the relevant independent variables in the mathematical characterizations can be shown to correspond to things that are already measured as part of standard industry practice.
- The individual subprocesses and overall process can also be modeled using standard computer modeling techniques.
- The individual subprocesses can be turned into electronic workflow.
- Data from the electronic workflow can be used to characterize actual process performance and can be compared to the modeling performed for the individual subprocesses in a way that allows deviations to be identified and corrected for.
Only the first item above will be discussed. The remaining points will be covered in the future.
The assertion above in (1) is that a clinical trial is made up of clearly characterizable individual subprocesses that are operationally and mathematically connected into one overall process whose final output is clinical trial data. So, step one is to determine what the individual subprocesses are that collectively make up a clinical trial as described above. Those subprocesses are: Site Selection, Site Activation, Patient Screening, Patient Enrollment, and Data Flow.
The next step is to characterize each subprocess.
Let’s look at the subprocess for Site Selection as an example. This subprocess can be easily process mapped as it is quite homogeneous and geographically agnostic in most cases: The Confidentiality Disclosure Agreement (CDA) is sent out, CDA is sent back, Site Questionnaire is sent out, Site Questionnaire is sent back, etc. If data are then collected regarding durations of each activity in the subprocess during the running of actual clinical trials, it is possible to produce characteristic output curves for each activity. The shapes of these output curves are quite similar for well-run clinical trials, regardless of therapeutic area, geography, etc. But, you will never see these similarities unless you characterize the overall subprocess, collect and visualize the appropriate activity data, and then analyze the shapes of the output curves.
But what about seeing the connections between subprocesses? Here, we instinctively recognize that the connections are there. After all, it is axiomatic that I can’t activate a trial site if I haven’t selected the trial site for inclusion in the study, I can’t screen/enroll patients if I haven’t activated the trial site, and I can’t generate study data if patients haven’t enrolled in the study. However, this type of thinking does not result in understanding the quantitative connections between subprocesses.
ln fact, many of us who work in the industry know that we rarely look for quantitative connections between subprocesses. We view these subprocesses as being more or less standalone processes. As a friend of mine at a global CRO once quipped, “ln this business, we all live on our separate islands … the Study Start Up island, the Project Management island, the Data Management island … and no one talks to anyone from any of the other islands”.
But the connections are there.
About 8 years ago, after I had transitioned from Big Pharma to a global CRO, I was given the opportunity to run a global Study Start Up group. Having come from a background in Engineering and Manufacturing, I assumed, given the complexity and expense inherent in a clinical trial, that there would be a significant amount of Operations Research literature on the clinical trial process, in general, and Study Start Up, in particular.
I was mistaken.
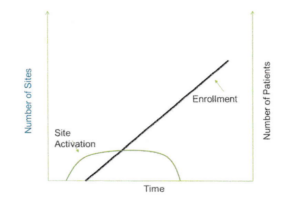
However, I did come across one excellent article by Dr. Gen Li in Pharmaceutical Executive magazine in the December 2008 issue entitled “Site Activation: The Key to More Efficient Clinical Trials” that had a fascinating graph in it. The graph showed a beautiful linear relationship between investigator site activation cycle time (the time from study start to the time all sites were activated) and patient enrollment cycle time (the time from study start to the time all patients were enrolled), for a number of clinical trials in a particular disease condition.
Dr. Li’s insights in the article are worth reading in and of themselves, but my Engineering training told me that any relationship that was as strong as the one shown meant that there was also a specific mathematical relationship between the two cycle times. After several years of exploration, I was able to determine the explicit mathematical connection between site activation and patient enrollment, and empirically verify the existence of that relationship by looking at clinical trial data for many trials in many indications. An idealized view of that relationship is shown in the plot below.
Plot 1: Idealized View of the Relationship Between Site Activation and Patient Enrollment
Ultimately, it was possible to leverage the insights provided by the mathematics to build a simple discrete model that allowed me to reproduce the linear relationship shown in Dr. Li’s research between site activation cycle times and patient enrollment cycle times.
Similar analysis can be done to discover the mathematical relationship between patient enrollment and how data flow in a clinical trial. Again, that this relationship exists makes intuitive sense since without a patient being enrolled in a clinical trial, no patient data for that patient can be generated. However, to be able to derive the mathematical relationship requires looking at the output curves for patient enrollment and data flow and recognizing the mathematics that drive the shapes of the output curves.
Eventually, it was possible to determine the characteristic shape of the output curve for each clinical trial subprocess, and co-plot the various output curves for Site Selection, Site Activation, Patient Screening, Patient Enrollment and Data Flow. The distinct pattern of these output curves has been empirically verified using comprehensive clinical trial data sets.
Since each subprocess was shown to be operationally and mathematically connected to the next subprocess, the implication was that a clinical trial can be optimized at every step to shorten the time required to complete the data collection and cleaning process. The desire to discover the independent variables that could be optimized to accomplish this cycle time reduction was the impetus to carry out the analysis articulated in step (2) above.
Galen, S. (2019, June 13). Clinical trials viewed through a manufacturing lens. Retrieved February 12, 2021, from https://navitaslifesciences.pages.salesfusion.com/Clinical-Trials-viewed-through-a-Manufacturing-Lens utm_source=website&utm_medium=post&utm_campaign=resources-article